A bitcoin pattern taking shape right now could send prices soaring to $76,000
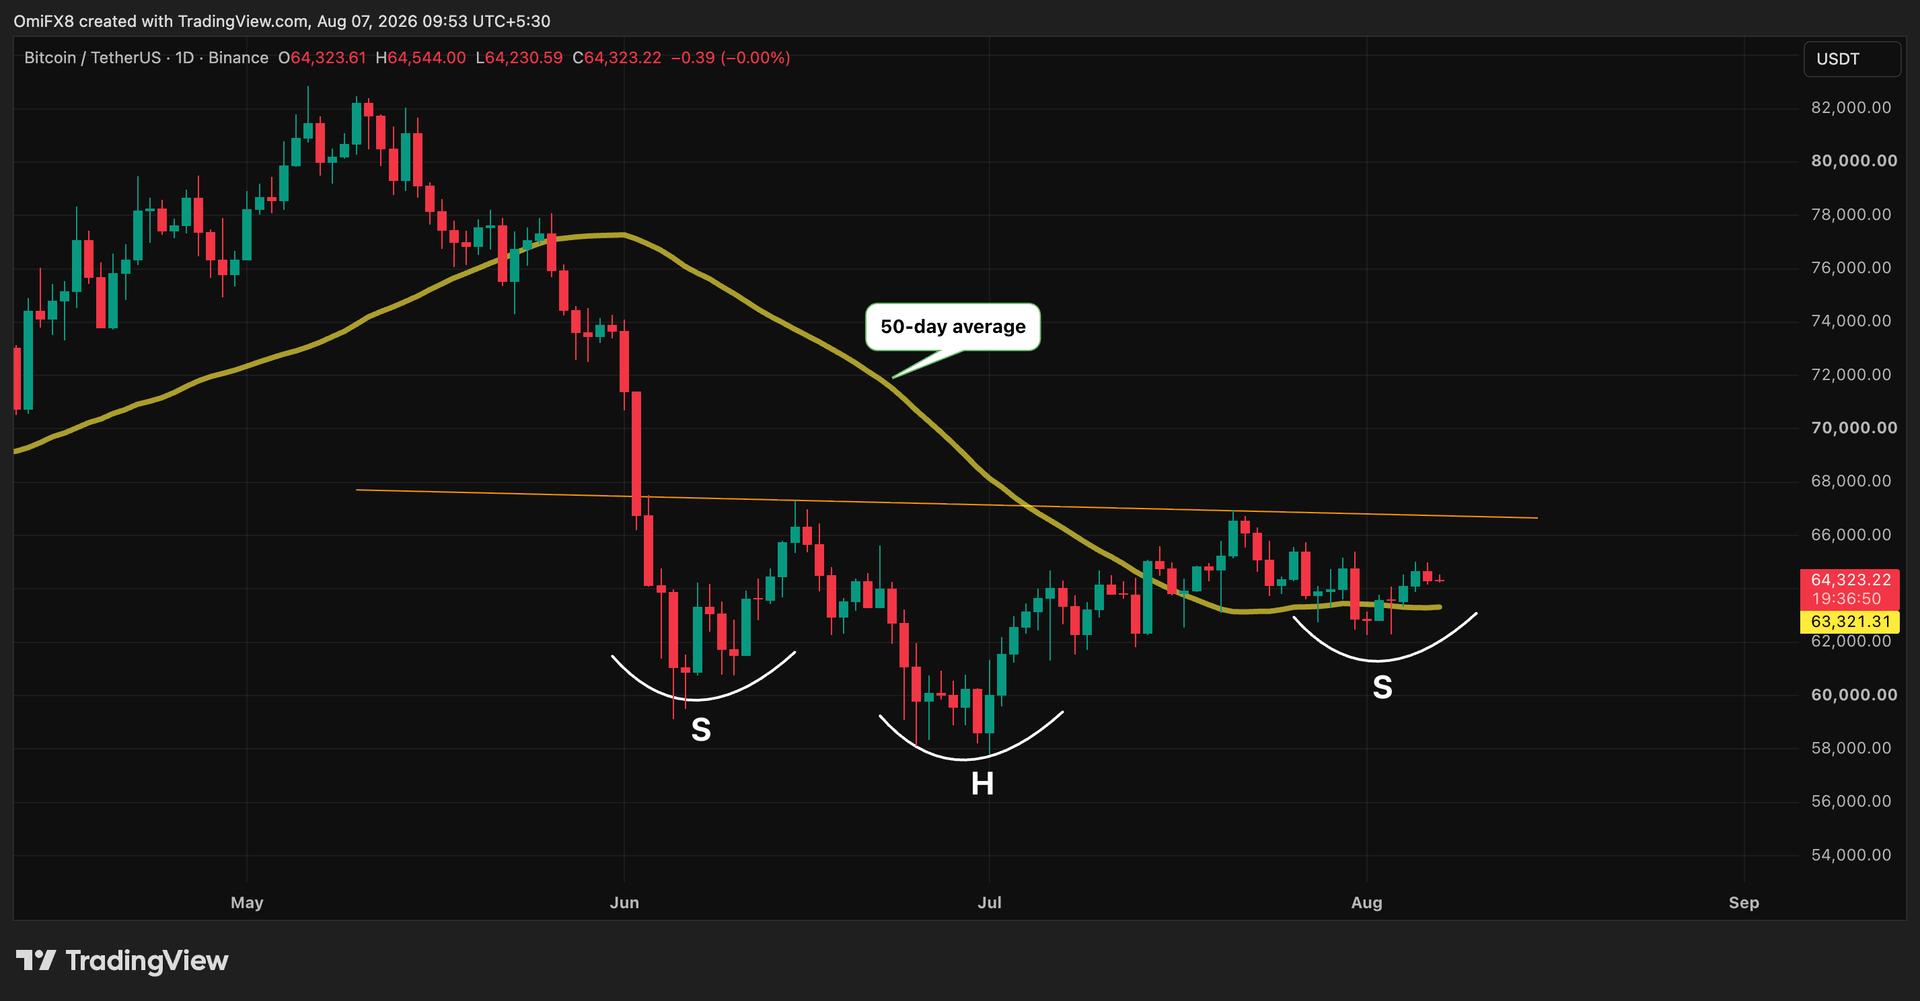
Connect those bounce highs and you get the neckline, sitting at roughly $66,800 as of this writing. That level is the trigger: if prices continue to rise and break decisively above it, chartists would treat it as confirmation, with a projected target near $76,000, based on the pattern's depth (the distance from neckline to head) added back on top of the breakout point.
Technical analysis patterns are inherently subjective, and some chartists may argue this setup doesn't fit textbook rules to the letter. But that's the nature of chart reading – it's an interpretive craft, not an exact science.
The inverse H&S is considered a reliable pattern by analysts.
Thomas Bulkowski, an internationally recognized expert on chart patterns, identifies it as a highly reliable bullish reversal setup, ranking 13th out of 39 for performance, with only an 11% break-even failure rate. His data, drawn from thousands of charts studied over years of traditional equity markets, shows that 71% of these patterns meet their measured price target, with a 65% rate of pulling back to retest the neckline first.
That said, an inverse H&S pattern remains a work in progress, not a confirmed signal. It is one scenario, not a guarantee. The pattern only activates if price actually clears and holds above the neckline.